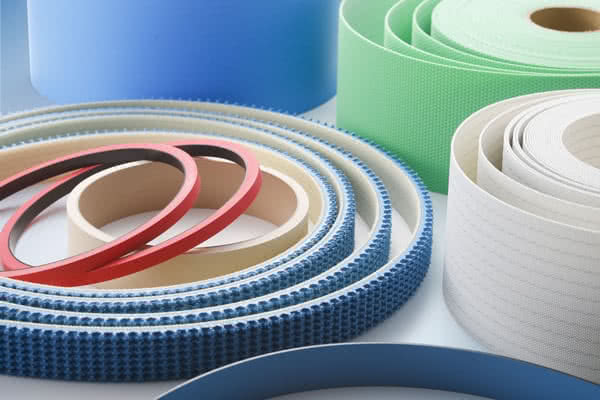
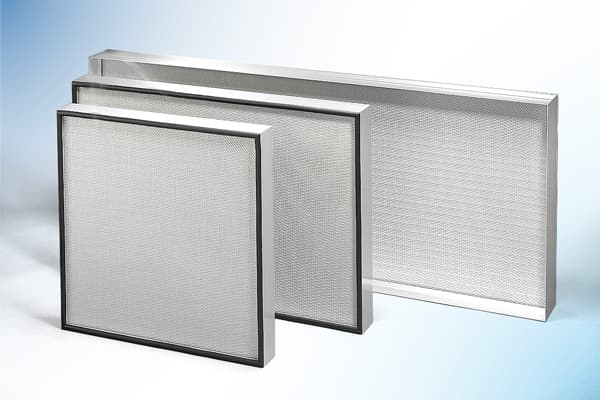
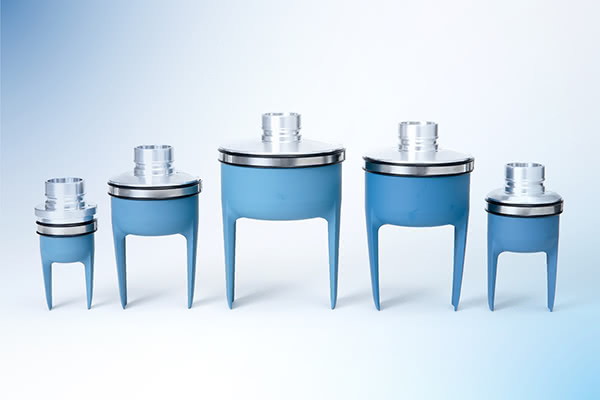
Large selection of products for wide range, high speed and free redirection
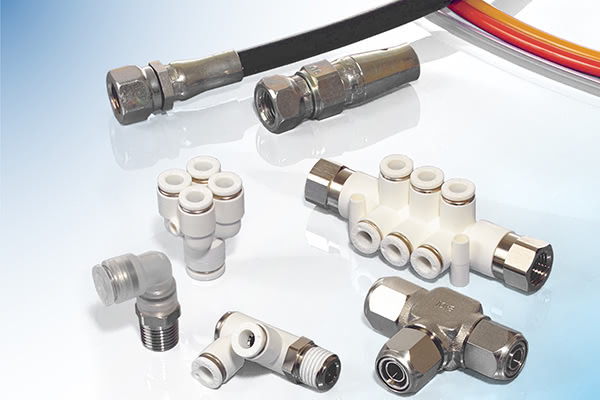
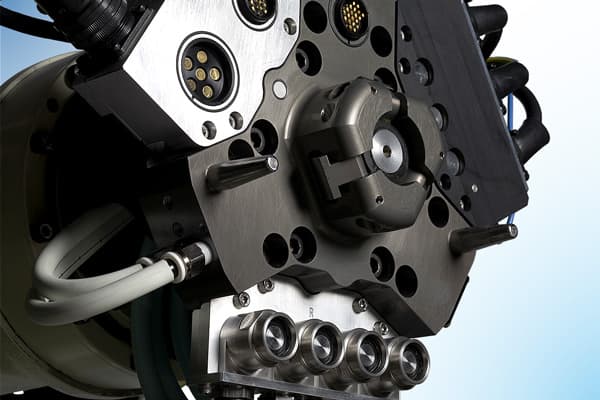
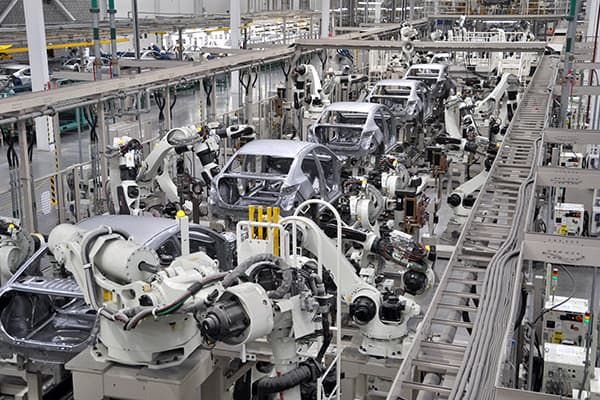
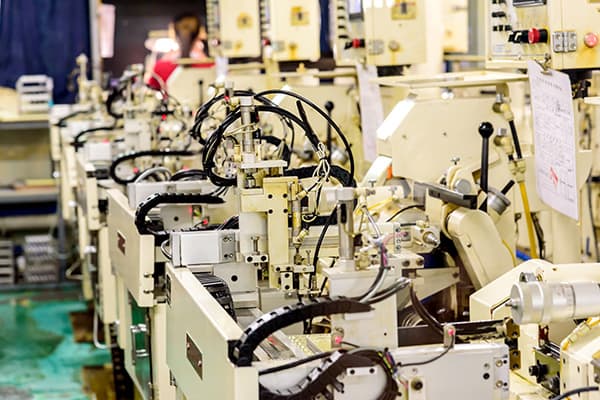
Heaby weight, High speed and narrow space
・・・Thank you for visiting us.・・・